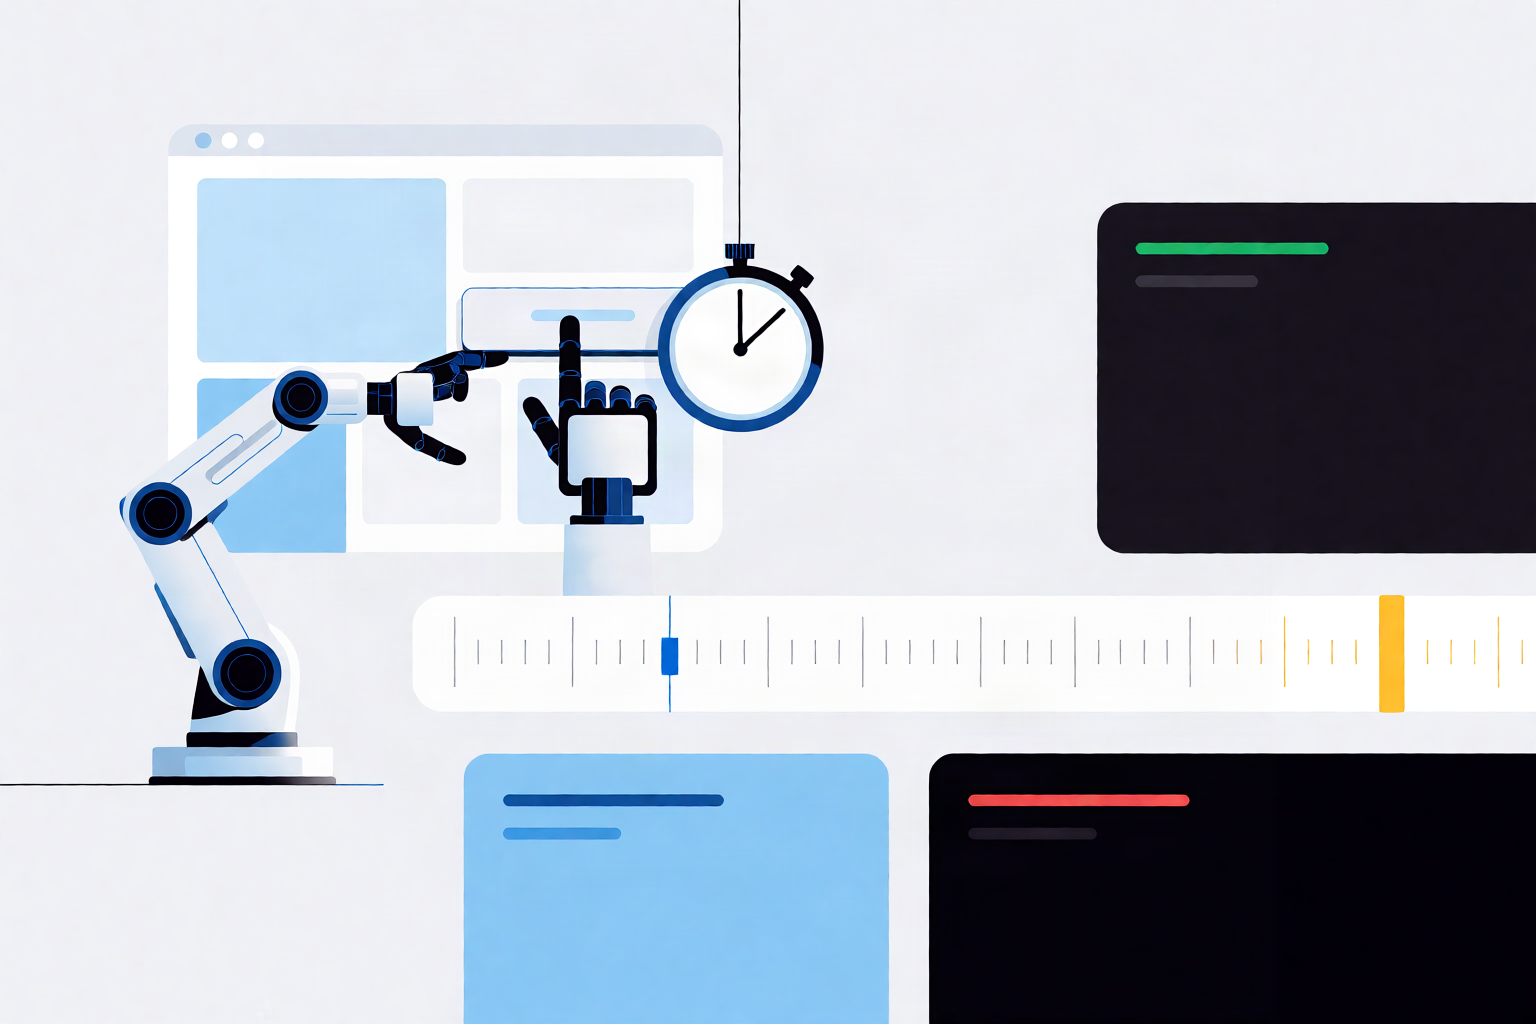
You benchmark an AI agent browser by measuring how fast the browser itself responds to agent actions, not just how fast the model thinks. Steel’s WebVoyager leaderboard evaluates agents across 643 live-web tasks on 15 popular websites, and its DRACO leaderboard covers 100 expert-graded research tasks across 10 domains. This is the essence of AI agent browser performance benchmarking: isolate browser latency, measure throughput, and replay deterministically.
Key takeaways
- Measure browser latency separately from LLM inference time.
- Track successful actions per minute, not just total task completion.
- Replay the same browser trace to isolate infrastructure changes.
- Headless browsers start faster but real browsers handle logins and anti-bot checks more reliably.
- Slow browsers multiply cost because agents pay for every retry and timeout.
Why does browser performance matter for AI agents?
AI agents spend most of their wall-clock time inside a browser: waiting for pages to load, clicking elements, and reading DOM updates. A slow browser forces the agent to retry actions, re-read pages, and burn LLM tokens on recovery. Browser latency is therefore a direct driver of user experience and operating cost. Model benchmarks tell only half the story; the other half is how fast the browser executes each step.
How do I measure AI agent speed?
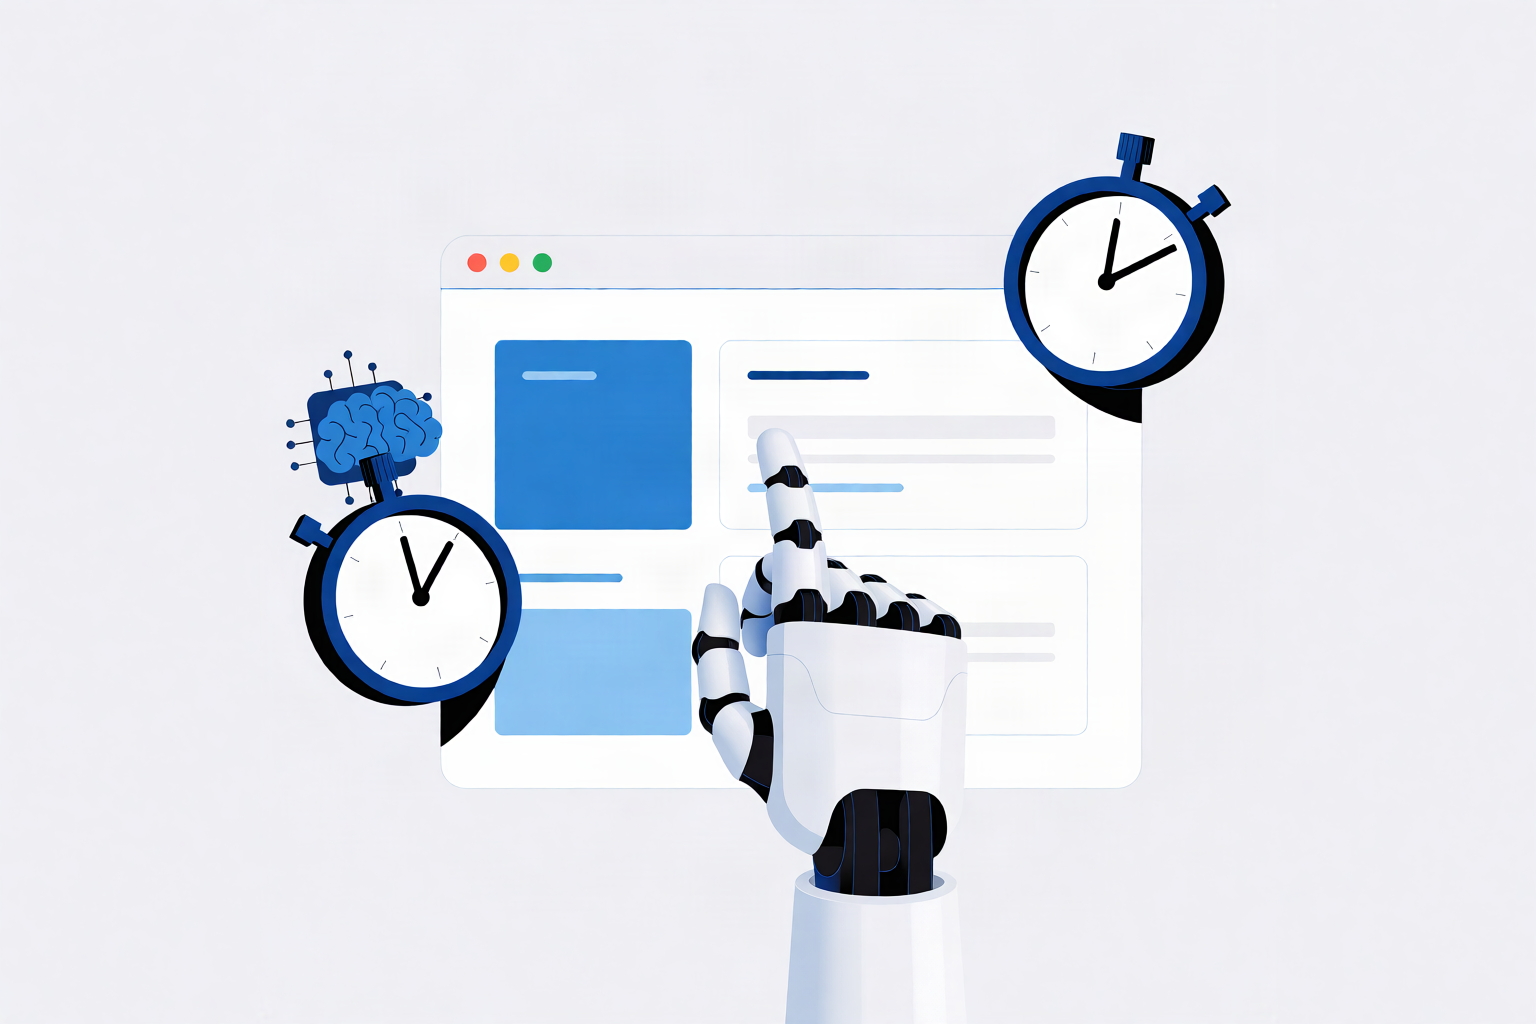
Measure the interval between the moment your agent issues a browser action and the moment the browser reflects that action in the DOM or network. That is your action latency. Separate it from LLM inference time so you know whether the bottleneck is the model or the browser. Use your browser automation tooling to timestamp before and after each click, type, or navigation, then aggregate the results across runs.
| Metric | What it measures | How to capture |
|---|---|---|
| Time to first byte | Server and network round-trip after navigation | Browser navigation timing API |
| Action latency | Click or type to observable DOM change | Timestamp before and after the action |
| Task completion time | End-to-end agent run | Harness start and end timestamps |
| Throughput | Successful tasks per unit of time | Successful actions divided by elapsed time |
What are AI agent throughput metrics?
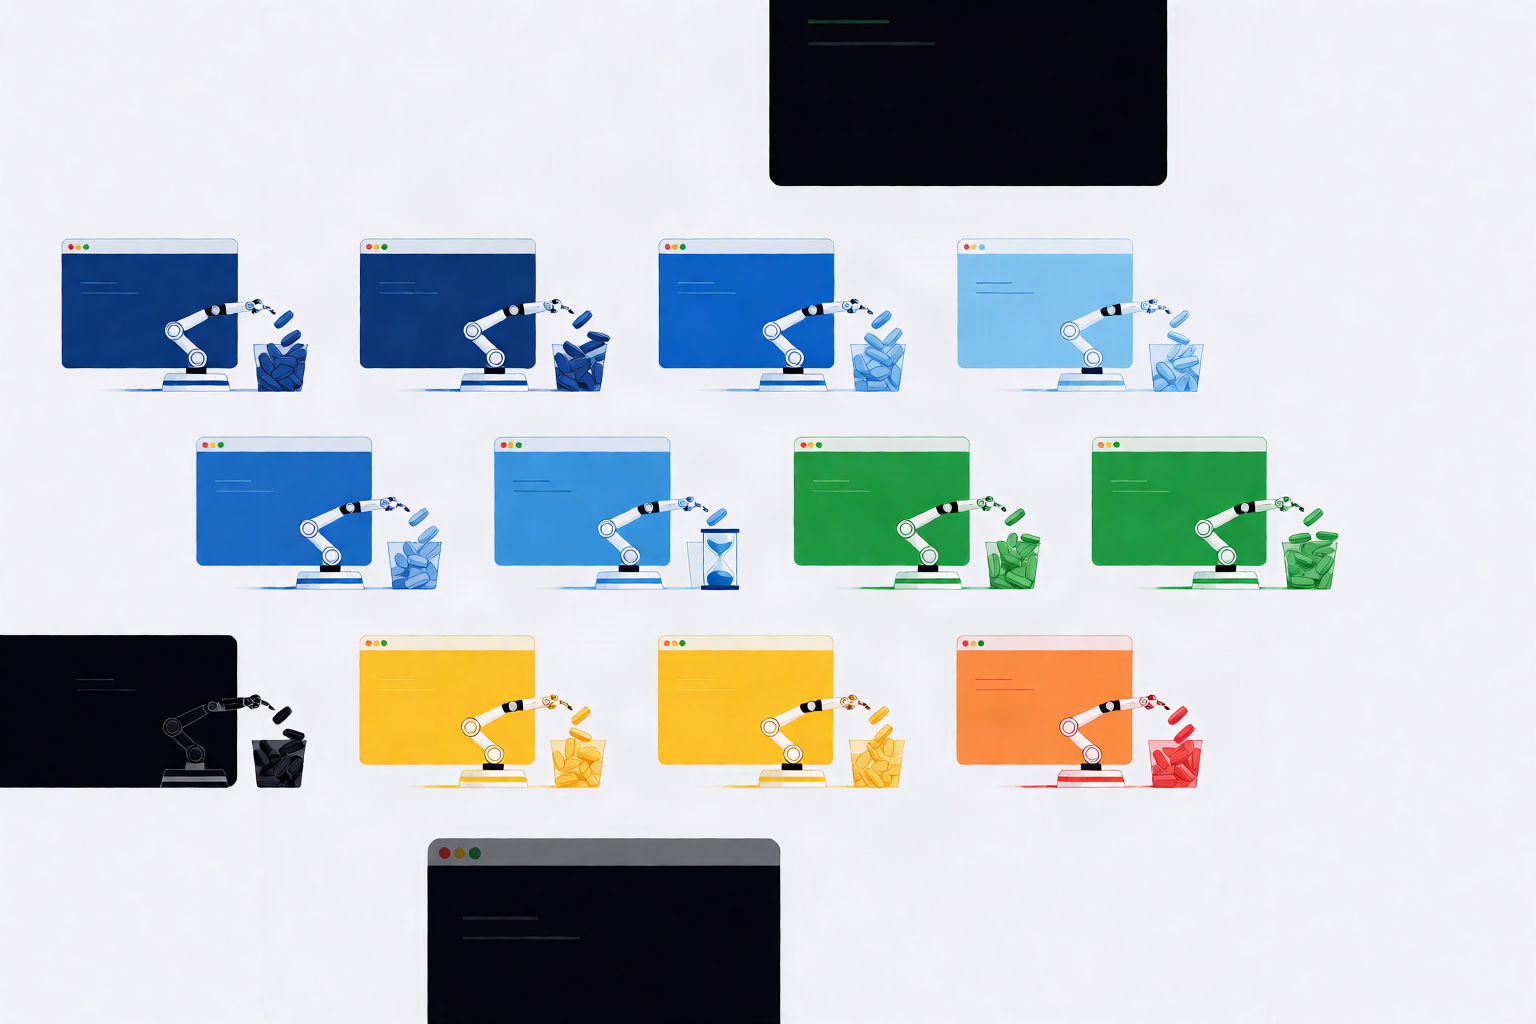
Throughput is the number of successful browser actions—or completed tasks—your agent can sustain per unit of time at a fixed concurrency. It is not the same as raw speed; a fast browser that crashes under load has poor throughput. Calculate it as successful actions divided by elapsed time, then multiply by your concurrency level. Track error rate alongside throughput, because a high volume of failed actions is not useful work.
What drives AI browser automation latency?
The biggest latency contributors are cold browser startup, navigation waits, JavaScript hydration, and headless detection challenges. LLM inference is often smaller than the browser round-trip for a single click. Real, logged-in browsers carry cookies and session state, which eliminates repeated login flows, but they consume more memory per instance. Headless browsers start faster and pack more densely, yet they can trigger CAPTCHAs or bot walls that add delays to a task.
How do I set up a benchmarking environment?
Use a fresh browser context for every run so cookies and cache do not leak between tests. Fix the viewport, user agent, and browser version. Instrument your harness to record a trace for each action: start timestamp, end timestamp, success flag, and any console errors. Store traces so you can replay them later and compare infrastructure changes against an identical baseline. For more on deterministic replay, see Implementing Deterministic Replay for AI Browser Agents: A Practical Guide.
const start = Date.now();
await page.click('[data-testid="submit"]');
await page.waitForResponse('**/api/order');
const latencyMs = Date.now() - start;
How do I execute performance tests?
Run the same task N times against the same site snapshot and browser version. Record p50, p95, and p99 latency for each action type, plus overall task completion time and error rate. Change one variable at a time—browser type, proxy, concurrency level, or resource blocking—and compare the distributions. Do not average away the tail; p99 tells you what your worst users experience.
How do I analyze results and identify bottlenecks?
Plot latency percentiles against concurrency. If p99 spikes while p50 stays flat, you have tail latency from retries, garbage collection, or flaky network conditions. If success rate falls as concurrency rises, you are exhausting memory, file descriptors, or browser instances. Correlate slow actions with specific URLs or DOM patterns to find pages that consistently trap your agent.
Should I use headless or real browsers for AI agents?
Headless browsers win on startup speed and instance density, which matters when you run thousands of short tasks. Real browsers win on authenticated workflows because they preserve cookies, localStorage, and login sessions, and they are less likely to trigger bot detection. Use headless for read-only, public tasks. Use real browsers when your agent must log in, maintain state, or navigate sites that block headless flags.
| Factor | Headless browser | Real browser |
|---|---|---|
| Startup time | Fast | Slower |
| Memory per instance | Low | Higher |
| Login and session state | Must be re-established | Persists naturally |
| Bot detection risk | Higher | Lower |
| Best use case | Public, read-only tasks | Authenticated, stateful workflows |
How do I optimize browser infrastructure for AI agents?
Reuse browser contexts across tasks instead of launching a new browser for every action. Warm up browsers before peak load so you do not pay startup latency on the first request. Block images, fonts, and tracking scripts that the agent does not need. Pin your browser version so automatic updates do not change performance mid-benchmark. When choosing where to run these browsers, weigh the operational overhead of self-hosting against managed services; see Choosing a Browser Infrastructure for AI Agents: Self-Hosted vs. Managed Services in 2026.
What is the cost of slow AI agents?
Slow browsers increase cost in three ways: more LLM tokens spent on recovery and re-reading, more agent runtime minutes billed by your infrastructure, and more failed tasks that require human intervention. An extra wait per action compounds across hundreds of actions in a single task. You can read more about the full cost picture beyond tokens in Optimizing AI Agent Costs: Beyond LLM Tokens with Efficient Browser Infrastructure.
How do I run browser infrastructure speed tests?
Run identical task suites against your browser infrastructure under increasing load. Measure navigation latency, action throughput, and context reuse overhead. Compare self-hosted browsers against managed services using the same agent code and the same target sites. The Steel leaderboard publishes methodology and scores for agent benchmarks; see Steel’s AI Agent Benchmark Leaderboards for a reference on how public leaderboards structure these comparisons.
How do I monitor AI agent performance continuously in production?
Export browser traces, action latency, and success rates to your observability stack. Alert on p95 latency growth or success-rate drops, and trace regressions to deploys, browser updates, or target-site changes. For tool selection, see Comparing AI Agent Observability Tools: A Developer's Guide to Production Readiness.
If you want to stop guessing about browser latency and start measuring it, Twin Browser provides infrastructure built for deterministic agent replay. Learn more at twin-browser.com.
FAQ
How do I measure AI agent speed?
Timestamp each browser action from issuance to observable DOM change or network response, then separate that interval from LLM inference time to isolate browser latency.
What are AI agent throughput metrics?
Throughput is successful actions or completed tasks per unit time at a fixed concurrency, tracked alongside error rate so failed attempts do not inflate the number.
Is headless browser performance for AI good enough?
Headless is fast and dense for public, read-only tasks, but real browsers are better for authenticated workflows because they preserve sessions and avoid headless detection.
What is the cost of slow AI agents?
Slow browsers raise LLM token use through recovery actions, increase infrastructure runtime, and generate failed tasks that require human intervention.
How do I optimize browser for AI agents?
Reuse contexts, warm up browsers before load, block unneeded resources, pin browser versions, and choose infrastructure that matches your authentication and concurrency needs.
Topics
AI agent browser performance benchmarking · measure AI agent speed · AI browser automation latency · AI agent throughput metrics · optimizing browser for AI agents · headless browser performance for AI · real browser performance AI agents · browser infrastructure speed tests